
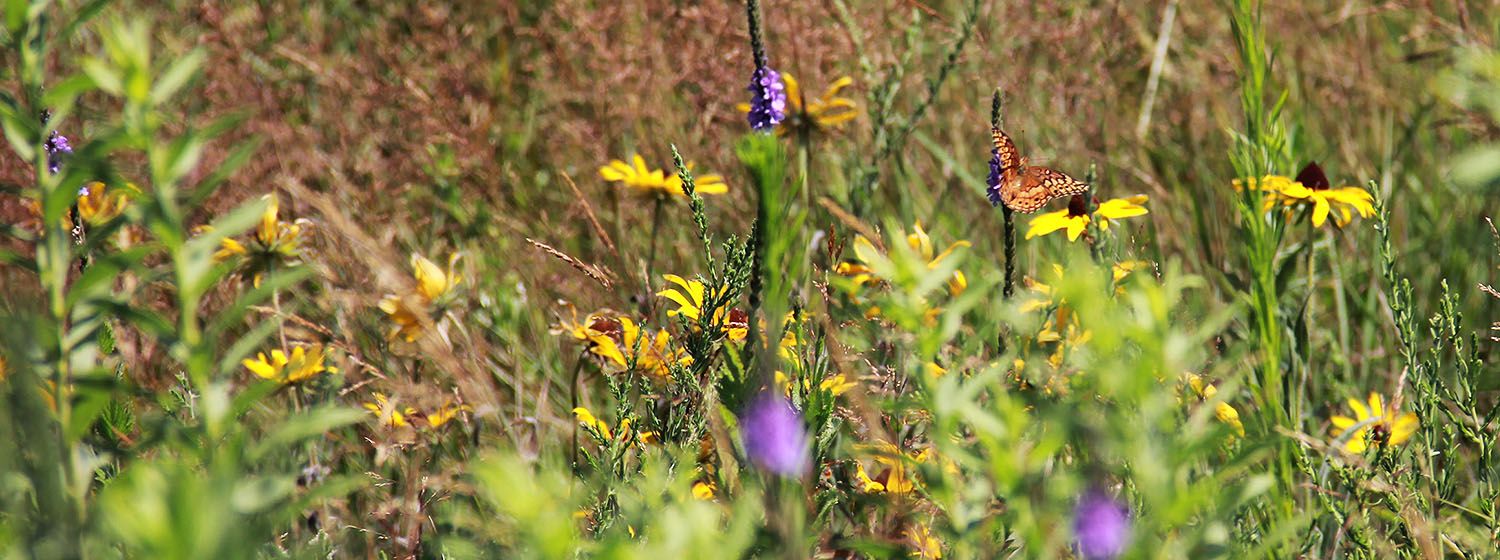
Photograph by Megan Soldatke
Why Survey Plants?
To monitor land management impacts on vegetation and understand long-term vegetation changes, through succession and climate change, we complete vegetation surveys. Half of our monitoring plots are surveyed from July 1st to October 1st each year. Our monitoring plots were created to sample a robust and representative area of distinct ecological zones and were randomly placed within these zones. We do two main things at each location, complete a point line intercept survey and a quadrat survey.
Point Line Intercept
To start, a 100m measuring tape is unraveled along our transect. Then Josh Wiese, Range Manager, uses a pin flag to identify the most dominant species per height class and ground cover type at every two-meter interval. He relays his findings to me, saying “PANVIR, ANDGER, HELANN, vegetated, fruiting, flowering, and bare ground.” It is my job to transcribe these six-letter plant codes (first three letters of their genus and species), their vegetative states (vegetative, flowering, fruiting, senesced), and what the ground cover is like (plant base, bare ground, rock/gravel, litter/duff) onto a data sheet like this. This is repeated 49 more times within the 100m.
Meter Veg. 0-0.5m VS Veg. 0.5-2.0m VS Veg. 2m+ VS Ground
1.5 PANVIR V ANDGER FR HELANN FL BG
In case you were wondering, PANVIR is Panicum virgatum, otherwise known as switchgrass. ANDGER is Andropogon gerardii, commonly known as big bluestem, and HELANN is Helianthus annuus or common sunflower.
Quadrat
When collecting quadrat data Josh uses a one by one and a half PVC pipe quadrat. With this tool, he can clearly outline ten quadrants in our 100-meter transect. Every ten meters Josh identifies all plants within the quadrant and gives me a percent cover for each species. There can be anywhere from 20 to 60+ species per survey. He calculates percent cover using ten-centimeter increments, which signify 5 percent of plant cover and ground cover, along our pipe quadrant. These measurements help us detect slight changes in species composition and cover in comparison to previous years. Below is an example of an extremely short quadrat data sheet.
Species/Ground Quad. 5m Quad. 15m Quad. 25m Quad. 35m Quad. 45m Quad. 55m Quad. 65m Quad. 75m Quad. 85m Quad. 95m
BG 10 0 5 25 15 0 0 0 5 10
LD 30 25 35 5 20 15 30 10 30 25
PANVIR 10 5 10 5 5 0 15 10 10 15
ANDGER 5 5 5 5 0 10 5 5 10 10
MORALB 15 0 5 0 0 15 0 10 5 5
HELANN 0 15 0 0 5 0 5 10 10 15
Through these surveys, we gather information on our plant community at a specific point in time, which provides us with precise data that can be compared throughout the years and used in making management decisions. This data is crucial to our mission.
Our Mission
Our mission of protecting and maintaining the physical, hydrological, and biological integrity of the Big Bend area of the Platte River to support whooping cranes, sandhill cranes, and other migratory birds is not possible without competent land management. In managing the land we burn, hay, mow, graze, rest, seed, plant, and more. These actions have benefits or consequences for each of our plant species within our land. Plant survey data describes where native and exotic species are located, how burn-ready the landscape is, and how past management practices have altered the plant community. This information in tandem with our understanding of each individual plant, which animals these plants positively or negatively impact, and our drive to improve upon our management practices inspires us to do these surveys. We push to do the fieldwork, compute the data, and discern how the landscape responds to our management to become better stewards of the land. Understanding our plant communities and how different management approaches affect them helps us support our cranes and other migratory birds. Through these practices, we provide them with their needed habitat.
Never Perfect
When it comes to restoration we cannot recreate historical nature. When this land was pristine there were no invasive species and few unnatural processes. With these changes comes a different ecosystem and a new set of challenges. Due to this, we will never be able to fully mimic nature, but we can inch closer to a healthier management style through science at the Crane Trust.
My Thoughts
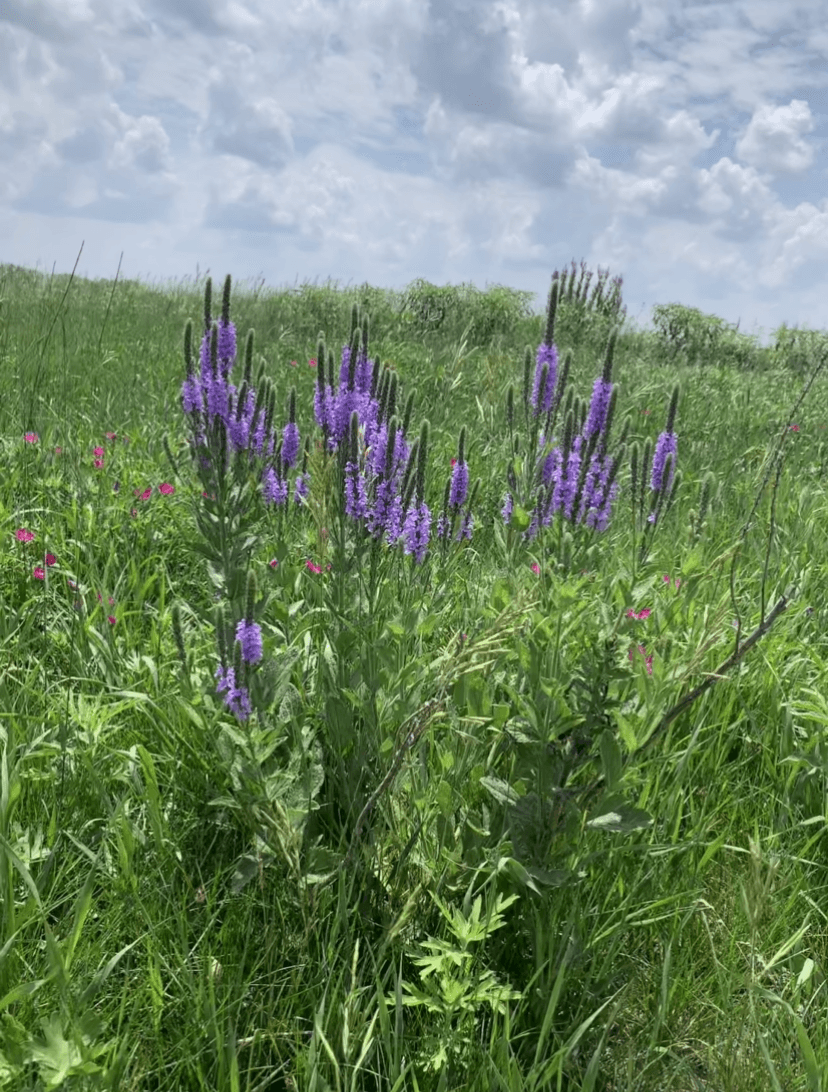
Being on half of this year's vegetation surveys has taught me a lot so far. I am no plant expert, but I can identify a handful of plants and understand how and why a survey is completed. In addition, transcribing this much information is challenging. I have to be laser-focused on every survey to write the correct plant codes, vegetative states, ground types, and percentages of cover. While working hard we have made some unexpected observations. Some interesting things we found in the field include seeing drastic changes in the plant community due to elevation, purple loosestrife being predated by Japanese beetles (both are exotic species), a redwing blackbird nest made with bison fur, and a germinated seed still on its parent's seed head this rainy July.
I hope you enjoyed learning about our vegetation surveys today!
See you in the next blog,
Matt Urbanski, Saunders Conservation Fellow
Fun Fact: The Crane Trust is home to more than 550 plant species!